
 Suche
Suche
 Mein Konto


The first detailed map of the Underside of an ice shelf shows melted areas in an unexpected form: tears. The new data that comes in todayScience Advancespublished could help researchers better understand how ice is affected by ocean currents and to more precise ones Predictions of sea level rise lead.
While remote-controlled diving vehicles have already penetrated beneath ice shelves, none of them have created a fine-resolution ice map before. “It's a bit like the Holy Grail in Antarctic oceanography,” said Anna Wåhlin, an oceanographer at the University of Gothenburg in Sweden and lead author of the study. “We had to completely overhaul our mental image of the ice when we received this data.”
Pings paint a picture
Floating ice shelves on seawater fed by glaciers on land that flow to the ocean. The new study describes the belly of the Dotson ice shelves, part of the West Antarctic Ice Sheet. Under the current scenario, the ice sheet could cause an average sea level rise of 3.2 meters if it suddenly collapsed. If Dotson were to break away, the land-based glaciers could be destabilized and accelerate their flow to the sea, Wåhlin and others say.
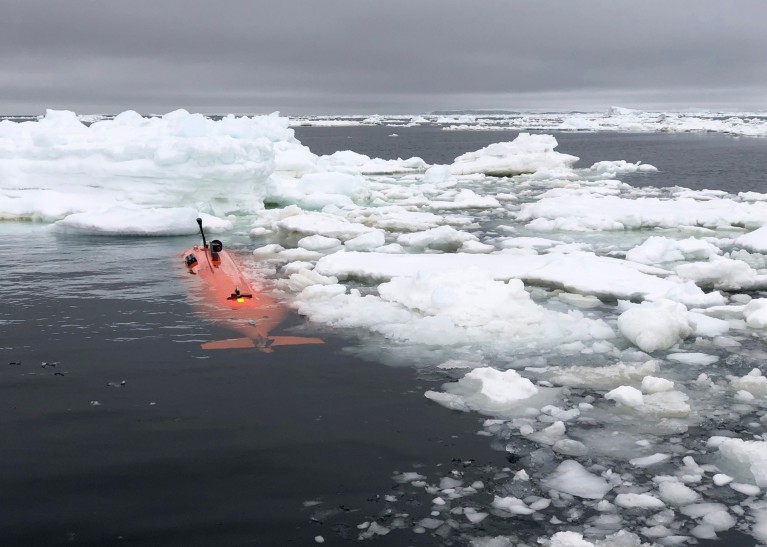
In 2022, Wåhlin and her colleagues sent a sonar-equipped underwater vehicle to map about 20% of the ice shelf. The vehicle repeatedly fired pings of 450 sonar beams that bounced off the shelf and returned to the submersible as it traveled in a lawnmower pattern under the ice for 27 days. The team also measured ocean currents and the temperature and salinity of the water below.
The researchers discovered more than 75 previously unknown teardrop shapes carved into the bottom of the ice shelf, ranging in length from 20 to 300 meters and an average depth of 14 meters. The tears were only observed on the western side of the shelf. This part of the shelf is thinner and is plagued by faster currents than the eastern side of the shelf.
The authors suspect that the friction between the ice and the ocean surface, as well as the circulation of water, could create a vortex that accelerates melting and creates these tear shapes, which the researchers called "enigmatic." But repeated observations are necessary to confirm this idea, says Wåhlin.
“These results are really important because the Antarctic ice sheet is changing rapidly,” said Hélène Seroussi, a glaciologist at Dartmouth College in Hanover, New Hampshire, who was not involved in the study. Changes in ocean conditions can accelerate melting, but most studies that quantify the rate of melting are limited by indirect observations such as remote sensing, she says.
Dangerous realm
Further direct observations of the bottom of the ice shelf are crucial for more accurate predictions of sea level rise, says Seroussi. “Without such observations, we can’t even begin.”
The team used the submersible again this year to repeat the mapping at Dotson and nearby Thwaites Glacier to map and evaluate this data. But they lost contact with the $3.8 million underwater vehicle during the latter part of their mission.
“We know there is a big risk in sending expensive equipment under hundreds of meters of ice,” says Wåhlin. “That’s why we don’t have this data yet.”